DOLfYN and additional ADCP processing/ plots #86
Description
Port DolfYN functionality over to MHKiT and update to use Pandas/xarray.
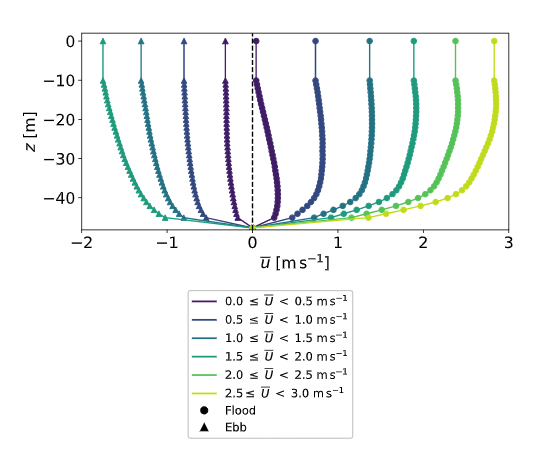
Add Additional functionality. One useful type of plot to write a script for is the vertical profiles of current velocity. The IEC draft standards call for the presentation of U-binned mean vertical current profiles, where each profile is the mean of all of the time events where depth-averaged U or U at a particular height above the bottom is within a certain range. Also, the IEC standards require the mean vertical profiles be extended to the water surface (assume the surface current is the same as the top good bin of observed currents) and the seabed (assume current is zero there), so MHKit could write a function to do that first. This plot is just for the u current. The bins are based on the mean horizontal current, U. Plots to show vertical profiles of u,v,w, and U would be useful. You could also do a similar plot of the tidal power density, which is TPD (W/m2) = 0.5 * rho *( U**3), where rho is the density of seawater (~1020 kg/m3)